

Campaign 02 Catalog-wide discovery
29.11% catalog ACoS: which products make economic sense?
Products can share an automatic campaign without sharing the same business objective. A mature item, a new launch and an accessory may each need a different advertising allowance. Read the product mix first; rebuilding the campaign is useful only if it gives those decisions better control.
In 30 seconds
Give each product a clear job before changing the catalog budget.
- What we see
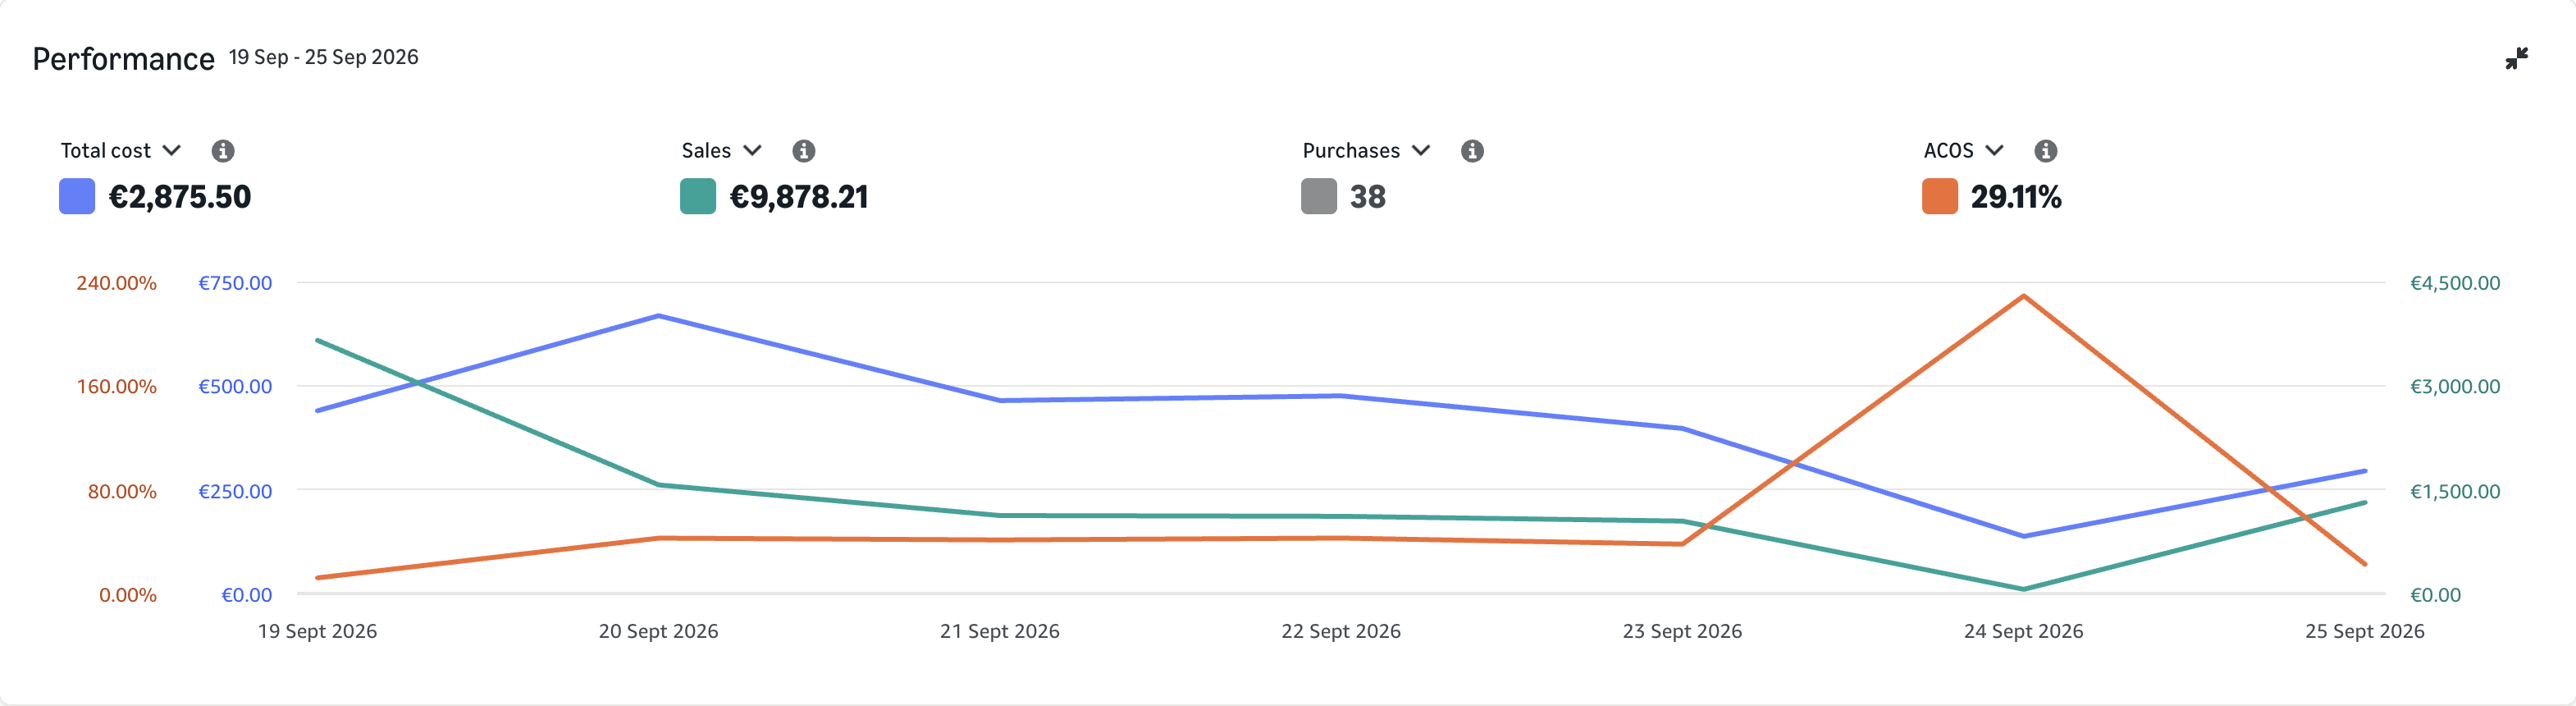
- The catalog campaign reports 38 purchases and 29.11% ACoS.
- What to check
- Break spend and outcomes down by product, then add each product’s costs and intended role.
- The next decision
- Separate product groups only where different objectives require different spending controls.
Observed campaign data from one advertising account. The steps below are proposals, not documented actions or measured improvements caused by Uptova.
Numbers & original evidence
- Ad spend
- €2,875.50
- Attributed ad sales
- €9,878.21
- Purchases
- 38
- ACoS
- 29.11%
View original capture
Swipe sideways to read. With a keyboard: focus the image region and use the left/right arrow keys.
Captured Enlarge original capture
The original interface is in English. The values and evidence have not been translated or recreated.
Our proposed action plan
Reconcile the product mix
Use the advertised-product report for the same dates and marketplace to list spend, attributed sales and purchases by product. Produce a product allocation sheet that reconciles to the campaign total. Keep unavailable outcomes marked as unavailable rather than assigning them zero or hiding those products.
Write a product objective
Combine the allocation sheet with the price and cost sheet, stock report and seller’s priorities. Produce a one-line objective and an advertising allowance for each product. Label a learning budget explicitly, with an owner and a limit, instead of treating it as an exception with no end.
Check where control is missing
Read the search-term report and existing campaign settings alongside the product objectives. Produce a grouping proposal showing which products need independent budgets or targeting and which can stay together. Keep the current structure where it already supports the decisions; more campaigns are not a goal in themselves.
Prepare one allocation change
Use the grouping proposal and current settings export to produce a before-and-after review for one supported segment. Name the products, proposed setting, exposure limit and review date. Preserve the rest of the catalog as context rather than combining a full rebuild with new prices and new targeting.
The starting point
This seven-day snapshot contains €2,875.50 in spend, €9,878.21 in attributed sales and 38 purchases. At 29.11% ACoS, ads cost €29.11 for every €100 in sales credited to them. Attributed sales are the sales amount linked to advertising under the report’s rules, rather than a measure of all catalog sales.
That percentage belongs to the campaign, not to every product in it. Different prices, product costs and purchase patterns can produce the same average. Another automatic campaign in the account is not a ready-made benchmark: compare the products and their objectives before deciding which budget deserves more room.
The strategic question
Start by asking what each product is supposed to achieve. An established item may be expected to acquire demand within a defined contribution goal. A new item may have a limited learning allowance. Both can be reasonable choices, but putting them under one unexplained target makes it hard to tell whether spend is doing its intended job.
Margin before ads is what remains from sales after the agreed product costs and selling costs, before advertising is paid. It differs across products, so one catalog ACoS cannot define affordability for all of them. The useful diagnosis is an allocation map, not a blanket verdict that 29.11% is good or bad.
How we would judge the test
Review the same products after an approved change, with the same attribution settings. Track spend against each product’s stated job and show purchases alongside the economic assumptions. A better campaign ACoS can simply mean that a larger share of sales came from a higher-priced product.
Also ask whether useful demand became harder to reach for products already meeting their objective. Keep stock, price and listing changes in the comparison notes. The resulting decision should say which product allowance changes and why, rather than rewarding a tidier catalog average.
Prepare a credible before/after
For a future test: use matching windows and reporting settings, and document price, stock and listing changes.
- 01 · Preserve the baseline
- Save the product-level spend, purchases and economic assumptions behind 29.11% ACoS, with each product’s intended objective.
- 02 · Document one change
- Document one approved product-group allocation change, the current settings and the maximum additional exposure it permits.
- 03 · Measure on equal terms
- Compare the same product set and separate within-product changes from a shift toward products with different prices or margins.
When to act — and when to wait
Change the allocation where product-level outcomes and the product’s objective justify it; keep different economic goals separate and leave an incomplete product diagnosis open.
Before approving a change
- Product totals reconciled to campaign spend
- Product costs and objectives recorded
- Learning budgets have owners and limits
- Grouping improves an actual decision
The central lesson
A useful catalog review turns one average into product decisions the seller can explain and revisit.
Evidence, methodology and further reading
The capture has no product-level breakdown. No weak or strong product segment has been established here yet.
How to read these case studies
- The high-resolution originals were captured directly in an authenticated Amazon Ads session on October 21, 2026. Every capture shows exactly one campaign in Germany. The first ten analyses cover September 19–25; five additional cases also compare September 12–18, 2026. Both weeks contain the same weekdays.
- These campaigns are a deliberately selected sample from one advertising account, not a representative average. Data is not combined across sellers. Account names, campaign names and IDs have been removed by cropping; numbers, chart lines, scales and dates are unchanged.
- ACoS = ad spend ÷ attributed ad sales. The period ratio uses period totals, not the average of daily percentages. Attributed ad sales are neither total revenue nor profit; margins, returns, taxes and organic revenue are absent from these captures.
- The five before-and-after comparisons show observed time windows, not a controlled experiment or a documented Uptova intervention. Review ideas are recommendations, not documented interventions. Lower ACoS can accompany fewer purchases; a week establishes neither durable profitability nor incremental sales.
- The captures were retaken without the pointer after the chart animation finished, then cropped only. No chart was generatively retouched. Cost, sales and ACoS use separate scales, not a shared value scale; gaps in the ACoS line can represent days without a defined daily ratio.
- Reports can use different levels of detail and attribution windows. Queries, products and placements remain separate views unless their relationship is verified. The purchased-product report discussed in these review plans shows purchases of other products but no ad cost; it cannot supply ACoS per purchased product.