

Campaign 03 Understanding daily patterns
18.22% ACoS: what does one weak day really tell you?
A sales chart moves every day; that alone does not mean the campaign needs daily repairs. This example shows how to distinguish an ordinary change in reported outcomes from a problem that deserves action, using daily reports and a simple timeline of what actually changed.
In 30 seconds
Look for a supported pattern, not a smoother-looking line.
- What we see
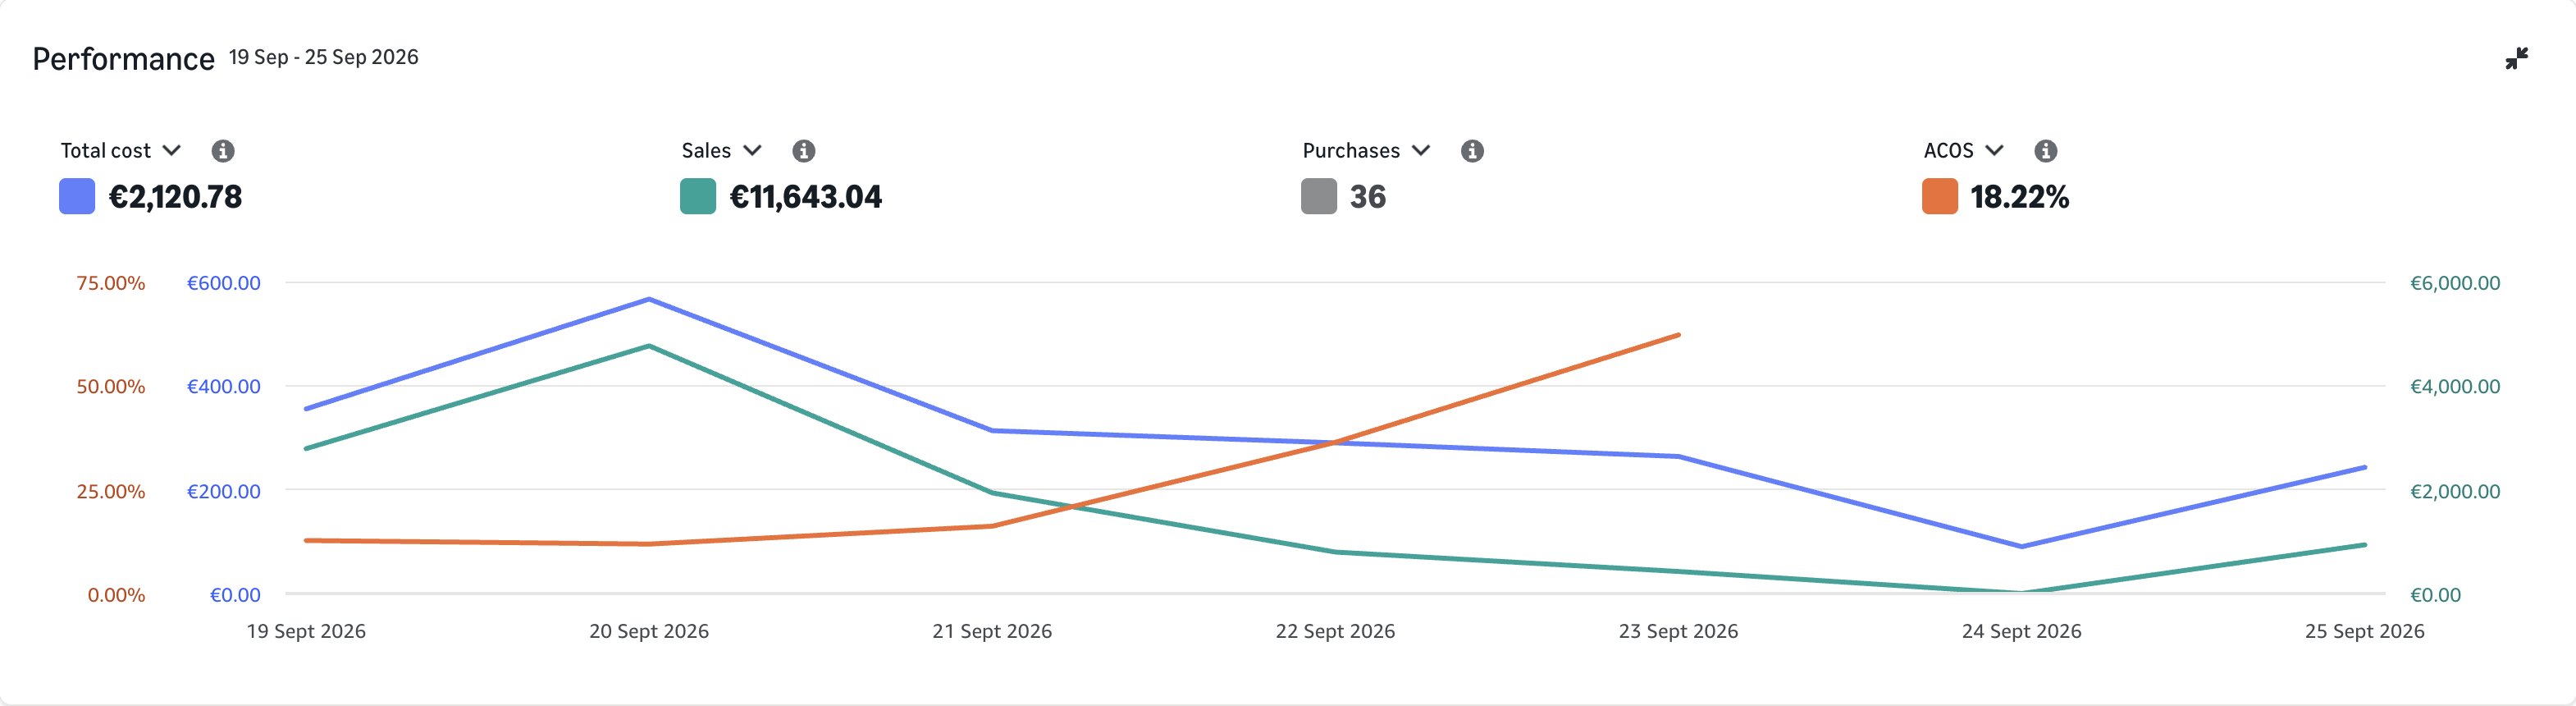
- The week reports 36 purchases and 18.22% ACoS, with uneven daily sales.
- What to check
- Reconcile daily totals and compare product mix, reporting settings and documented changes.
- The next decision
- Respond to a repeated, explainable issue rather than one low-sales day.
Observed campaign data from one advertising account. The steps below are proposals, not documented actions or measured improvements caused by Uptova.
Numbers & original evidence
- Ad spend
- €2,120.78
- Attributed ad sales
- €11,643.04
- Purchases
- 36
- ACoS
- 18.22%
View original capture
Swipe sideways to read. With a keyboard: focus the image region and use the left/right arrow keys.
Captured Enlarge original capture
The original interface is in English. The values and evidence have not been translated or recreated.
Our proposed action plan
Make a daily reconciliation
Use the daily campaign report with the same dates, currency and attribution settings as the capture. Produce a day-by-day sheet of cost, sales and purchases that reconciles with the period totals. Add extraction dates and leave ACoS undefined wherever the sales denominator is zero.
Build a factual timeline
Read the campaign change history, stock records and recorded price or listing changes. Produce a dated timeline containing only verified events. Put it beside the daily sheet to identify questions worth checking; two events sharing a date do not by themselves establish a cause.
Compare like with like
From product and search-term reports, select matching products, query families and complete reporting windows. Produce a comparison that shows both the common scope and any excluded or unavailable rows. If the comparison changes product mix, label that difference before choosing a winner.
Write a scoped response
Use the comparison and the affected product’s economic allowance to produce either a hold decision or one proposed target adjustment. Include current settings, intended change and the evidence that would reverse it. A weekly chart does not supply the hourly data needed for a scheduling decision.
The starting point
The campaign records €2,120.78 in spend, €11,643.04 in attributed sales and 36 purchases, producing 18.22% ACoS. In plain terms, €18.22 of ad cost accompanies each €100 in sales credited to ads. The chart varies substantially during the week, including a day without attributed sales in the observed series.
The capture was taken on October 21, 26 days after this September 19–25 window ended. No attribution delay is established here. Check the report settings, but do not explain the historical dips as immature recent days. A day without sales has no defined cost-to-sales ratio; that is different from especially cheap traffic.
The strategic question
The week’s 36 purchases do not explain the daily sales variation on their own. Product mix, shopping demand, availability and documented account changes are useful things to check. None is established as the cause by the shape of this chart. A campaign label also does not verify its audience or targeting configuration.
A meaningful issue is a pattern that survives those checks: for example, spend repeatedly reaching the same product or query without meeting its agreed objective. That calls for a scoped response. A single dip followed by a rebound is a reason to inspect the underlying reports, not a ready-made reason to cut or raise bids.
How we would judge the test
Calculate the period ACoS from total cost divided by total attributed sales, not the average of daily percentages. Review where purchases and spend are concentrated. That reveals whether the potential issue belongs to the whole campaign or only to a particular product, query or day.
For a future approved adjustment, record its effective time and later retail changes. Wait until its attribution window is sufficiently complete, then compare matching weekdays. If the pattern does not repeat, retain the current settings and the monitoring record rather than adding another change to an already variable series.
Prepare a credible before/after
For a future test: use matching windows and reporting settings, and document price, stock and listing changes.
- 01 · Preserve the baseline
- Archive daily cost, sales and purchases with report settings, including days whose daily ACoS cannot be calculated.
- 02 · Document one change
- Record one approved adjustment and its effective time, or a documented hold when no repeatable problem is supported.
- 03 · Measure on equal terms
- Recompute ratios from matching period totals and inspect the same products and weekdays, keeping concurrent events in view.
When to act — and when to wait
Act when a verified pattern conflicts with the affected product’s objective; retain the settings when no repeatable issue is supported, and resolve scope or product-mix differences before comparing another period.
Before approving a change
- Daily and period totals reconciled
- Historical scope and report settings verified
- Verified change timeline attached
- Response addresses a repeated pattern
The central lesson
The useful question is not why every day differs, but whether a specific decision would improve the way the campaign is managed.
Evidence, methodology and further reading
A weekly chart provides no hourly evidence. Any audience strategy suggested by a campaign name needs a separate check.
How to read these case studies
- The high-resolution originals were captured directly in an authenticated Amazon Ads session on October 21, 2026. Every capture shows exactly one campaign in Germany. The first ten analyses cover September 19–25; five additional cases also compare September 12–18, 2026. Both weeks contain the same weekdays.
- These campaigns are a deliberately selected sample from one advertising account, not a representative average. Data is not combined across sellers. Account names, campaign names and IDs have been removed by cropping; numbers, chart lines, scales and dates are unchanged.
- ACoS = ad spend ÷ attributed ad sales. The period ratio uses period totals, not the average of daily percentages. Attributed ad sales are neither total revenue nor profit; margins, returns, taxes and organic revenue are absent from these captures.
- The five before-and-after comparisons show observed time windows, not a controlled experiment or a documented Uptova intervention. Review ideas are recommendations, not documented interventions. Lower ACoS can accompany fewer purchases; a week establishes neither durable profitability nor incremental sales.
- The captures were retaken without the pointer after the chart animation finished, then cropped only. No chart was generatively retouched. Cost, sales and ACoS use separate scales, not a shared value scale; gaps in the ACoS line can represent days without a defined daily ratio.
- Reports can use different levels of detail and attribution windows. Queries, products and placements remain separate views unless their relationship is verified. The purchased-product report discussed in these review plans shows purchases of other products but no ad cost; it cannot supply ACoS per purchased product.