

Campaign 07 Concentration in the result
6.42% ACoS, seven purchases: ready to scale?
Seven purchases can produce an attractive weekly ratio without telling you how often the opportunity will repeat. This review focuses on concentration: how much of the result comes from a few products, days or valuable purchases, and what that means for the next allocation test.
In 30 seconds
Understand what carries the seven-purchase result before expanding it.
- What we see
- The campaign reports seven purchases and 6.42% ACoS.
- What to check
- Inspect how sales value and spend are distributed across products, queries and days.
- The next decision
- Consider a bounded test for a supported product opportunity instead of a general budget increase.
Observed campaign data from one advertising account. The steps below are proposals, not documented actions or measured improvements caused by Uptova.
Numbers & original evidence
- Ad spend
- €281.38
- Attributed ad sales
- €4,383.00
- Purchases
- 7
- ACoS
- 6.42%
View original capture
Swipe sideways to read. With a keyboard: focus the image region and use the left/right arrow keys.
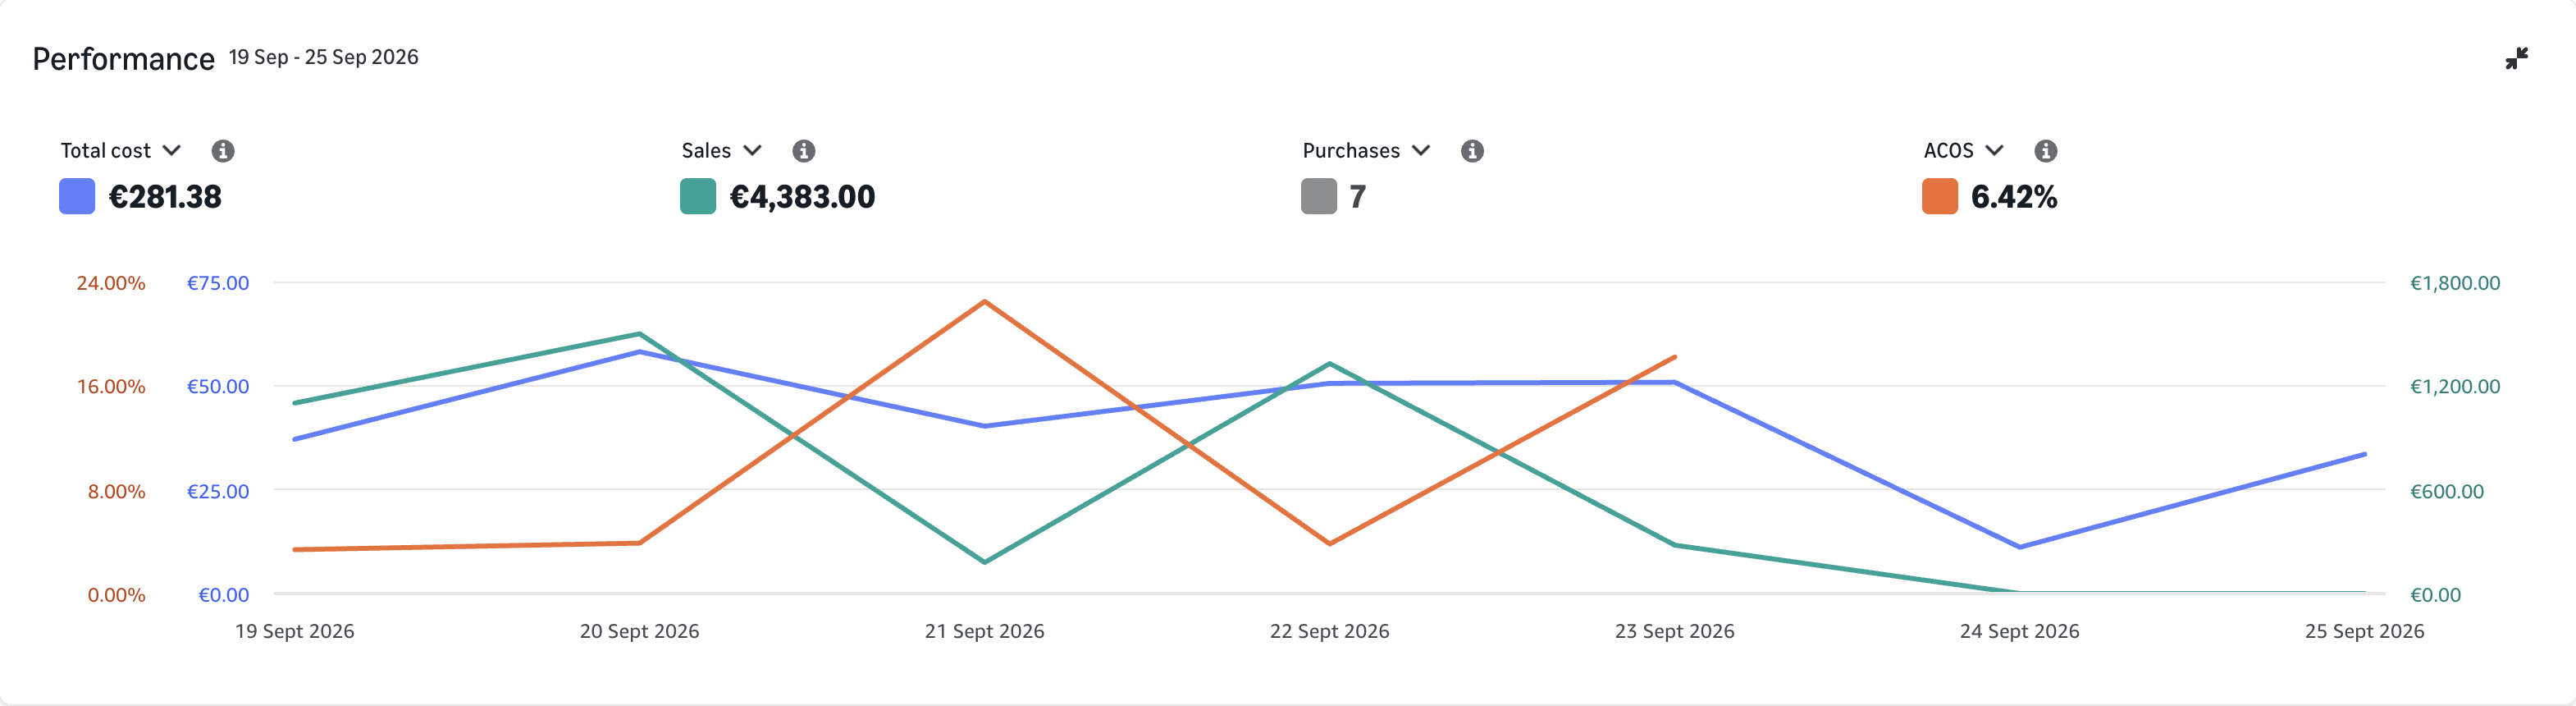
Captured Enlarge original capture
The original interface is in English. The values and evidence have not been translated or recreated.
Our proposed action plan
Show the available composition
Use the advertised-product report for ad spend, sales and purchases. Add the purchased-product report separately: it covers purchases of other products and has no ad cost. Produce two labelled views, checking attribution windows before reconciliation. The second is not a breakdown of all seven purchases; do not allocate costs to purchased ASINs or invent their ACoS.
Locate the concentration
Read each view at its reported level to identify the largest visible sales contributions and the campaign’s strongest days. Produce a concentration note with unresolved product or query links marked. Keep 6.42% unchanged; a sensitivity check explains dependence on large contributions without deleting them from the observed totals.
Check the repeatable offer
Combine the leading product opportunities with the price and cost sheet, stock report and current listing review. Produce a readiness note stating the economic allowance and any documented change since the week shown. This checks whether the same offer remains available; it does not assume a stock or listing failure.
Prepare a bounded allocation test
Use the readiness note and existing targeting export to produce one proposed product–query test, with its current coverage, exposure cap and review condition. Preserve useful discovery coverage and check existing dedicated targets. Set the limit from the product allowance, not from an expectation that 6.42% will persist.
The starting point
Across the selected week, the campaign spends €281.38 and records €4,383.00 in attributed sales from seven purchases. Its 6.42% ACoS means €6.42 of ad cost per €100 in sales credited to ads. It is a period result, not a promise that additional spend can buy the same mix of purchases.
Purchases, units and customers are different counts. Seven purchases do not establish seven identical baskets or seven separate customers. The screenshot also does not show how sales are distributed across products. A small number of valuable outcomes could carry much of the total; the product reports are needed to find out.
The strategic question
This differs from the catalog-objective question in case 02. There the task is to give products different economic jobs; here the first task is to understand how concentrated the observed result is. With seven purchases, the seller needs to know whether several opportunities contributed or whether the story depends heavily on one segment.
Concentration is not automatically a reason to stop. Infrequent, valuable demand can be worth pursuing when product economics support it. Margin before ads is sales less the agreed product and selling costs before advertising; add it to the product view so a high sales value is not mistaken for a high contribution.
How we would judge the test
After an approved test, report purchase counts and concentration alongside cost and sales. Ask whether the supported product opportunity appears again under comparable conditions. Another high-value purchase is useful evidence, but it may still leave the result dependent on very few outcomes.
Also show how much extra spend was used to obtain the new observations. A growing sales total can reflect a changed product mix rather than a more repeatable acquisition process. The review can reasonably remain inconclusive while keeping the test within its agreed allowance.
Prepare a credible before/after
For a future test: use matching windows and reporting settings, and document price, stock and listing changes.
- 01 · Preserve the baseline
- Save each verified view behind the seven-purchase total, with attribution windows, report detail and unresolved product or query links.
- 02 · Document one change
- For one approved product opportunity, record the allocation test, existing coverage, maximum exposure and review condition.
- 03 · Measure on equal terms
- Compare concentration and purchase counts as well as cost and sales, keeping a sparse result distinct from repeatable demand.
When to act — and when to wait
Expand only a product opportunity whose economics and current offer are supported, using a bounded test; keep a general increase on hold while the sales composition and repeatability remain unclear.
Before approving a change
- Seven purchases reconciled to the product view
- Units and customers not inferred from purchases
- Concentration assessed without changing reported totals
- Extra exposure capped by product economics
The central lesson
The next useful number is not a larger budget. It is a clearer picture of which opportunity produced the result.
Evidence, methodology and further reading
Seven purchases are neither seven verified customers nor a forecast for additional spend.
How to read these case studies
- The high-resolution originals were captured directly in an authenticated Amazon Ads session on October 21, 2026. Every capture shows exactly one campaign in Germany. The first ten analyses cover September 19–25; five additional cases also compare September 12–18, 2026. Both weeks contain the same weekdays.
- These campaigns are a deliberately selected sample from one advertising account, not a representative average. Data is not combined across sellers. Account names, campaign names and IDs have been removed by cropping; numbers, chart lines, scales and dates are unchanged.
- ACoS = ad spend ÷ attributed ad sales. The period ratio uses period totals, not the average of daily percentages. Attributed ad sales are neither total revenue nor profit; margins, returns, taxes and organic revenue are absent from these captures.
- The five before-and-after comparisons show observed time windows, not a controlled experiment or a documented Uptova intervention. Review ideas are recommendations, not documented interventions. Lower ACoS can accompany fewer purchases; a week establishes neither durable profitability nor incremental sales.
- The captures were retaken without the pointer after the chart animation finished, then cropped only. No chart was generatively retouched. Cost, sales and ACoS use separate scales, not a shared value scale; gaps in the ACoS line can represent days without a defined daily ratio.
- Reports can use different levels of detail and attribution windows. Queries, products and placements remain separate views unless their relationship is verified. The purchased-product report discussed in these review plans shows purchases of other products but no ad cost; it cannot supply ACoS per purchased product.