

Campaign 13 Broad: cost and attributed sales
28.50% ACoS, €70.97 per purchase: what actually improved?
ACoS improves, but advertising cost per reported purchase rises. This comparison of a campaign labelled Broad shows how a higher attributed sales value per purchase can change the headline ratio. Inspect both sides of the calculation before treating it as cheaper acquisition or a reason to scale.
In 30 seconds
A lower ACoS does not necessarily mean a lower advertising cost per purchase.
- What we see
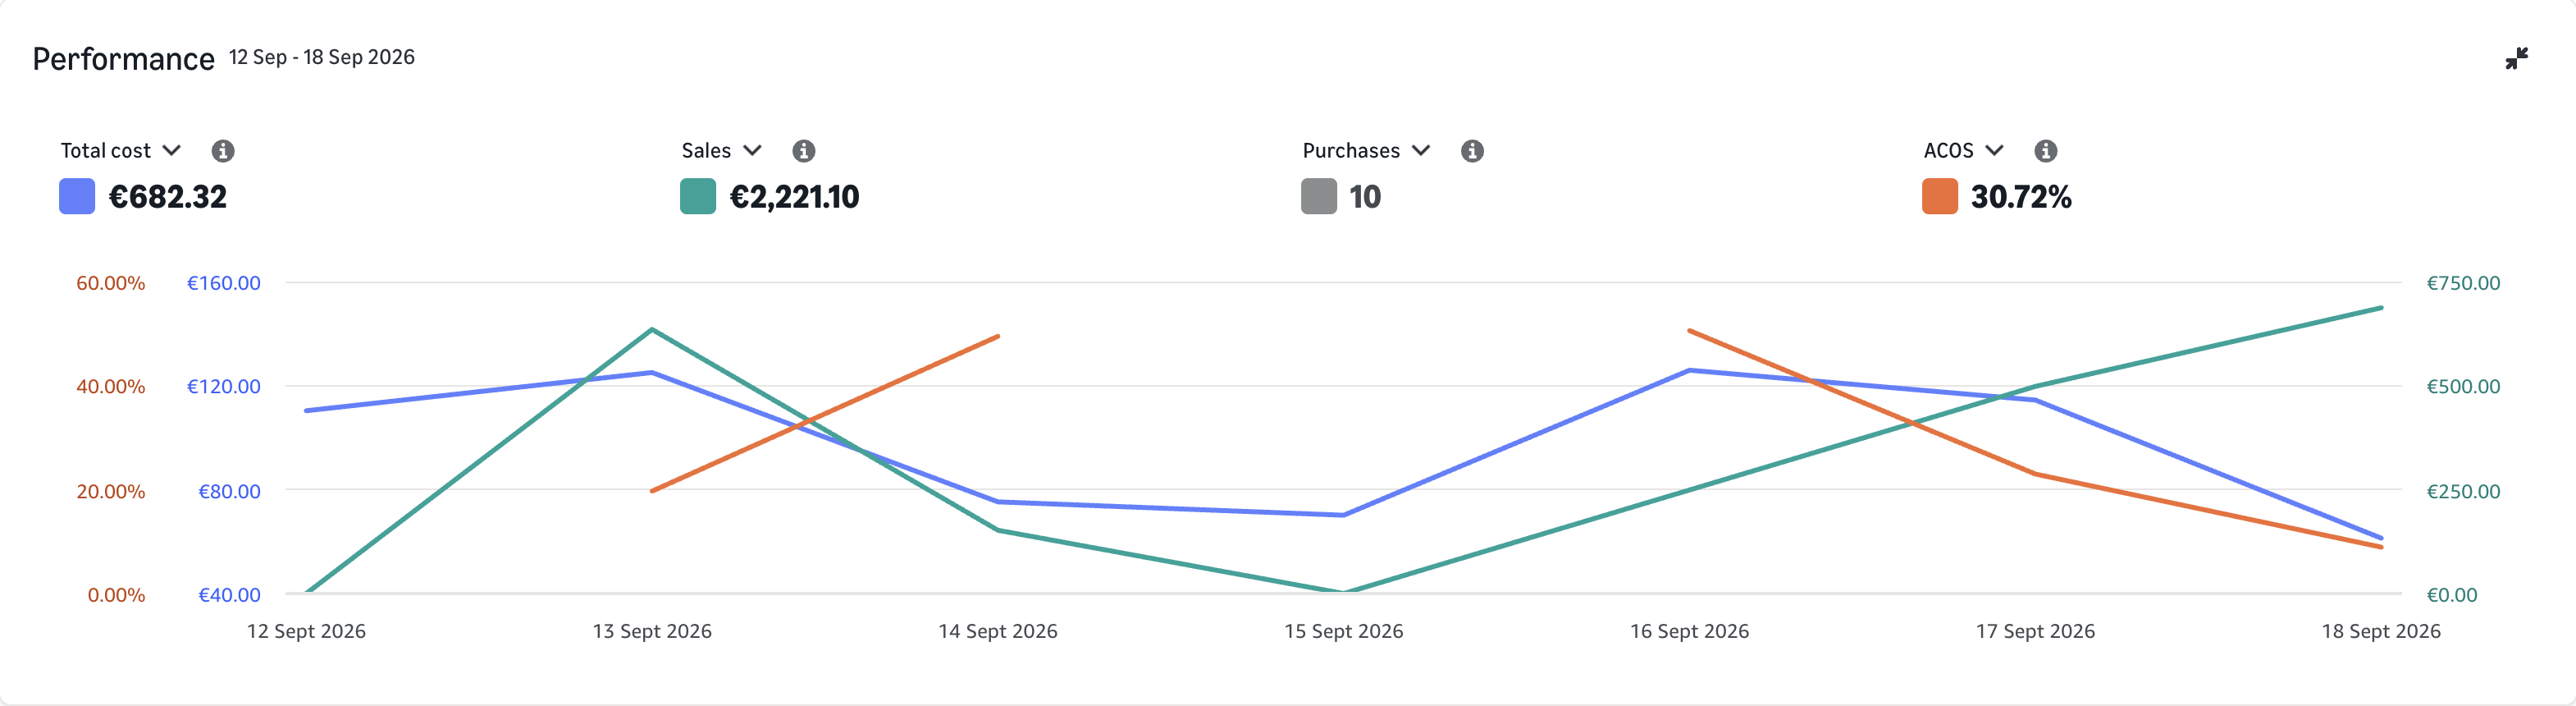
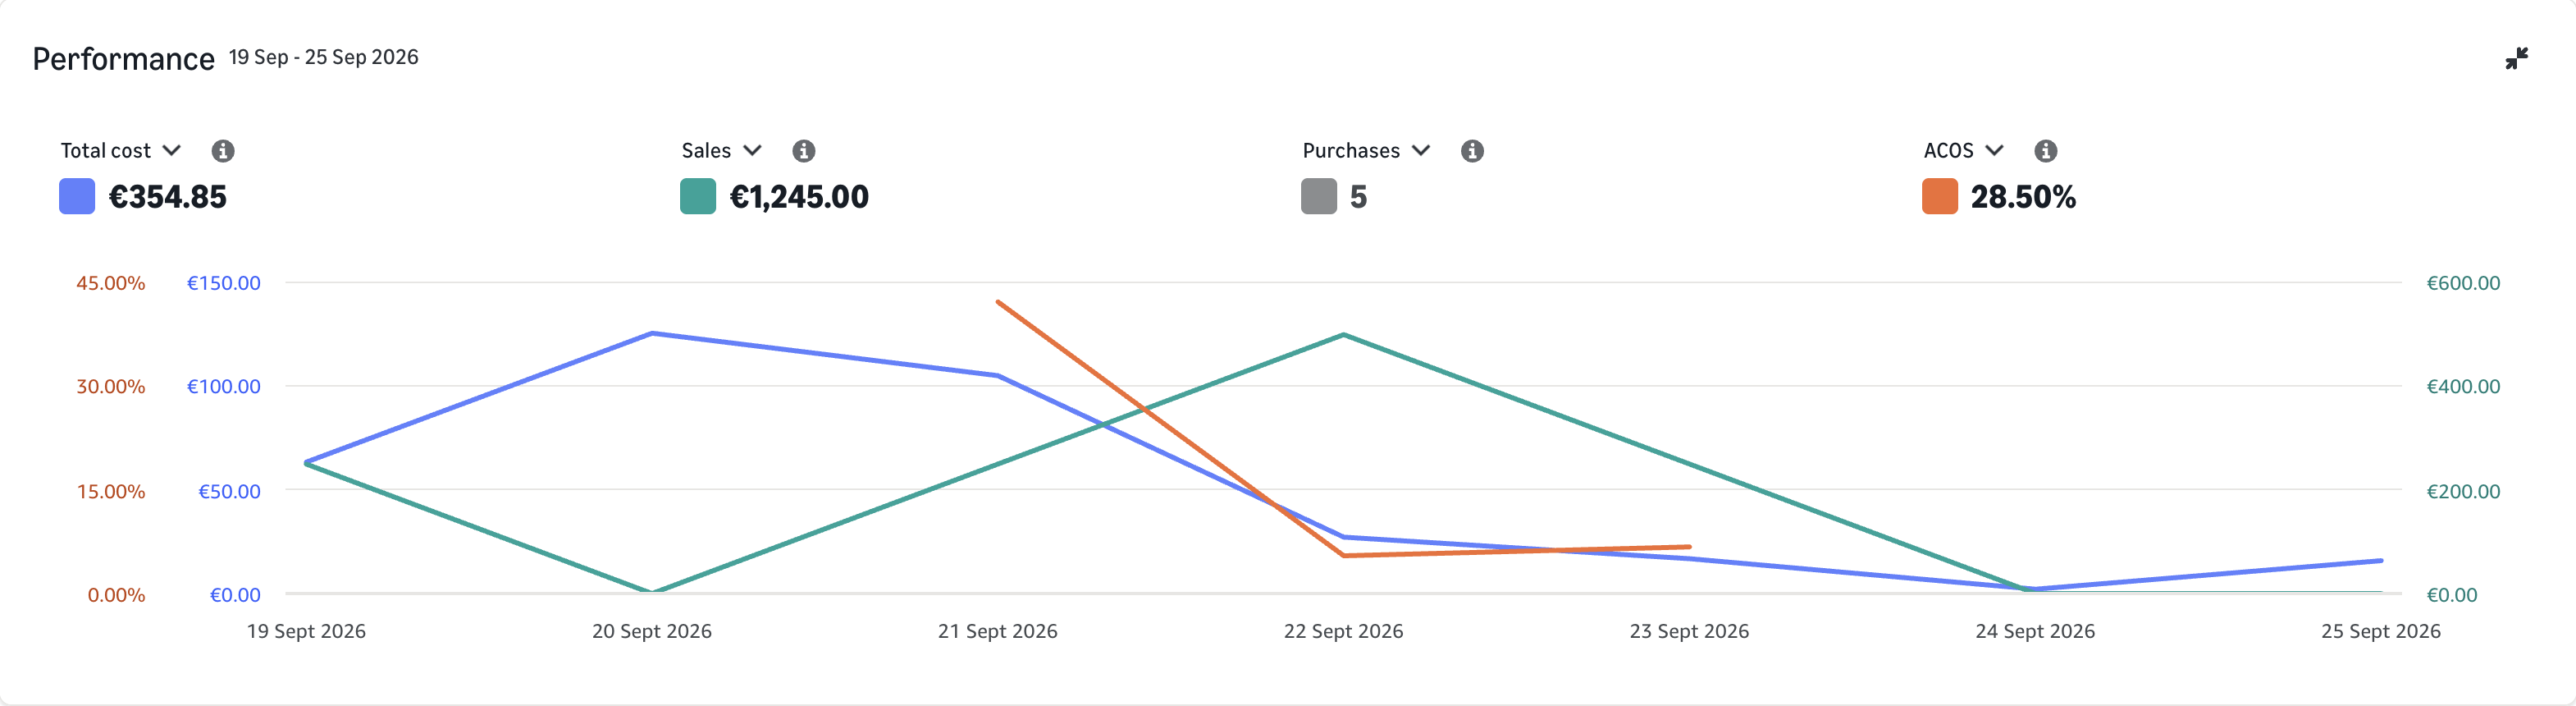
- ACoS falls from 30.72% to 28.50%, while purchases fall from ten to five and spend from €682.32 to €354.85.
- What to check
- Separate cost per reported purchase from attributed sales per reported purchase, then inspect the actual query and product mix.
- The next decision
- Do not scale from ACoS alone. Revisit one query-level proposal when report coverage and product economics support it.
Observed campaign data from one advertising account. The steps below are proposals, not documented actions or measured improvements caused by Uptova.
Numbers & original evidence
Both weeks at a glance
Sep 12–18, 2026Sep 19–25, 2026
Ad spend
- Before
- €682.32
- After
- €354.85
- Change
- -47.99%
Attributed ad sales
- Before
- €2,221.10
- After
- €1,245.00
- Change
- -43.95%
Purchases
- Before
- 10
- After
- 5
- Change
- -50.00%
ACoS
- Before
- 30.72%
- After
- 28.50%
- Change
- -2.22 percentage points
Ad cost per purchase
- Before
- €68.23
- After
- €70.97
- Change
- +4.01%
Attributed ad sales per purchase
- Before
- €222.11
- After
- €249.00
- Change
- +12.11%
Calculated from period totals. Purchases are ad-attributed purchases, not unique customers. Sales per purchase is neither total basket value nor margin.
View both original captures
The original interface is in English. The values and evidence have not been translated or recreated.
Before · earlier period
Sep 12–18, 2026
Swipe sideways to read. With a keyboard: focus the image region and use the left/right arrow keys.
Captured Open the earlier week’s original
After · later period
Sep 19–25, 2026
Swipe sideways to read. With a keyboard: focus the image region and use the left/right arrow keys.
Captured Open the later week’s original
Chart scales can differ; compare the numbers, not the height of the lines.
Our proposed action plan
Write the two ratio components
Reconcile the weekly totals under matching report settings. Show cost per reported purchase and attributed sales per reported purchase alongside ACoS and purchase count. Deliver a two-row calculation sheet that makes the higher purchase cost visible instead of describing the lower ACoS as cheaper acquisition.
Find the reported query shifts
Compare the actual search-term reports. For queries present in both windows, show costs, attributed purchases and sales. Mark incomplete coverage separately. The output is a shortlist of query-level changes, not a search-volume estimate; an absent row is not a confirmed zero or proof that market demand disappeared.
Check the product and existing Exact coverage
Associate a query with its advertised product only where supported. Add that product’s cost model and existing keyword coverage. Where available, inspect product-level sales aggregates without assuming a complete purchase distribution. Deliver one candidate whose economics and control purpose are clearer than the campaign average.
Choose routing or continued observation
For that candidate, specify whether separate Exact control would improve a concrete decision. Record the current setting, proposed change, maximum cost and review date. If product economics or query coverage is unresolved, continue observation rather than increasing the Broad budget or creating structure for its own sake.
The starting point
The earlier September 12–18 window shows €682.32 in spend, €2,221.10 in attributed sales and ten purchases. The later September 19–25 window shows €354.85, €1,245 and five purchases. Both captures concern the same German campaign over equal-length windows with matching weekdays. The campaign label suggests Broad targeting; its actual target settings need separate verification.
ACoS improves by 2.22 percentage points. Yet spend divided by reported purchases rises from €68.23 to €70.97, or 4.0%. Attributed sales divided by reported purchases rises from €222.11 to €249, or 12.1%. These ratios use the same campaign totals; they are not an order-level basket value, product margin or measure of incremental customers.
The strategic question
The arithmetic explains why the two findings can coexist: ACoS equals cost per reported purchase divided by attributed sales per reported purchase. The second value rises more than the first. That describes the aggregate ratio, not why it changed. Prices, products, quantities and attribution may differ; none is established as the cause here.
Broad keywords can reach different queries. The next investigation therefore concerns reported query and product composition, not a presumed fall in Amazon search demand. Click counts, click prices and product margins are missing. Fewer campaign purchases establish neither lower total search demand nor improved conversion or profit.
How we would judge the test
After an approved routing test, assess the same query across source and destination. Keep purchase count and both ratio components beside ACoS. A cheaper-looking destination is insufficient if the source continues spending or the combined result exceeds the product allowance.
Use complete, equal-length windows and record price, stock and listing changes. Agree the maximum exposure and review date before testing. Compare like-for-like reported segments where possible; if the composition changes or coverage is incomplete, record that rather than declaring a winner.
What this weekly comparison establishes
Keep the original periods and the evidence needed for a follow-up test documented separately.
- 01 · Preserve the baseline
- Earlier capture: ten purchases, €682.32 in spend and 30.72% ACoS from the same campaign.
- 02 · Document one change
- No specific intervention is established. A possible budget or bid change is not presented as a verified event.
- 03 · Measure on equal terms
- Later capture: five purchases, €354.85 in spend and 28.50% ACoS; the ratio difference alone does not establish profit.
When to act — and when to wait
For now, do not scale the campaign from its lower ACoS. Revisit one routing proposal when the query is reported, the product relationship is verified and the advertising allowance supports it. Reassess at the agreed review date or earlier if the combined spending boundary is reached.
Before approving a change
- Both ratio components calculated
- Reported query shifts separated from market demand
- Product economics and Exact coverage checked
- Source and destination cost boundary agreed
The central lesson
Here, the ratio improves while cost per reported purchase rises. Make the next decision at the supported segment level.
Evidence, methodology and further reading
A better ratio establishes neither more profit nor more efficient access to the same query mix.
How to read these case studies
- The high-resolution originals were captured directly in an authenticated Amazon Ads session on October 21, 2026. Every capture shows exactly one campaign in Germany. The first ten analyses cover September 19–25; five additional cases also compare September 12–18, 2026. Both weeks contain the same weekdays.
- These campaigns are a deliberately selected sample from one advertising account, not a representative average. Data is not combined across sellers. Account names, campaign names and IDs have been removed by cropping; numbers, chart lines, scales and dates are unchanged.
- ACoS = ad spend ÷ attributed ad sales. The period ratio uses period totals, not the average of daily percentages. Attributed ad sales are neither total revenue nor profit; margins, returns, taxes and organic revenue are absent from these captures.
- The five before-and-after comparisons show observed time windows, not a controlled experiment or a documented Uptova intervention. Review ideas are recommendations, not documented interventions. Lower ACoS can accompany fewer purchases; a week establishes neither durable profitability nor incremental sales.
- The captures were retaken without the pointer after the chart animation finished, then cropped only. No chart was generatively retouched. Cost, sales and ACoS use separate scales, not a shared value scale; gaps in the ACoS line can represent days without a defined daily ratio.
- Reports can use different levels of detail and attribution windows. Queries, products and placements remain separate views unless their relationship is verified. The purchased-product report discussed in these review plans shows purchases of other products but no ad cost; it cannot supply ACoS per purchased product.