

Campaign 12 Automatic targeting across two weeks
€184.85 instead of €401.39: why does ACoS still rise to 33.24%?
An automatic campaign spends 53.9% less, while attributed sales fall by 64.7%. The useful next step is to locate the reported decline, not choose a new bid from the campaign average. Separate text queries from product contexts, then identify which supported segments deserve attention.
In 30 seconds
A smaller bill does not automatically resolve a weaker relationship between ad spend and attributed sales.
- What we see
- €401.39 in spend and seven purchases become €184.85 and three purchases. ACoS rises from 25.47% to 33.24%.
- What to check
- Identify the largest reported declines by query or product context, keeping missing rows separate from confirmed zeroes.
- The next decision
- Keep a campaign-wide bid change on hold. Revisit one segment after its traffic, reported outcomes and product allowance are available.
Observed campaign data from one advertising account. The steps below are proposals, not documented actions or measured improvements caused by Uptova.
Numbers & original evidence
Both weeks at a glance
Sep 12–18, 2026Sep 19–25, 2026
Ad spend
- Before
- €401.39
- After
- €184.85
- Change
- -53.95%
Attributed ad sales
- Before
- €1,575.95
- After
- €556.14
- Change
- -64.71%
Purchases
- Before
- 7
- After
- 3
- Change
- -57.14%
ACoS
- Before
- 25.47%
- After
- 33.24%
- Change
- +7.77 percentage points
Ad cost per purchase
- Before
- €57.34
- After
- €61.62
- Change
- +7.46%
Attributed ad sales per purchase
- Before
- €225.14
- After
- €185.38
- Change
- -17.66%
Calculated from period totals. Purchases are ad-attributed purchases, not unique customers. Sales per purchase is neither total basket value nor margin.
View both original captures
The original interface is in English. The values and evidence have not been translated or recreated.
Before · earlier period
Sep 12–18, 2026
Swipe sideways to read. With a keyboard: focus the image region and use the left/right arrow keys.
Captured Open the earlier week’s original
After · later period
Sep 19–25, 2026
Swipe sideways to read. With a keyboard: focus the image region and use the left/right arrow keys.
Captured Open the later week’s original
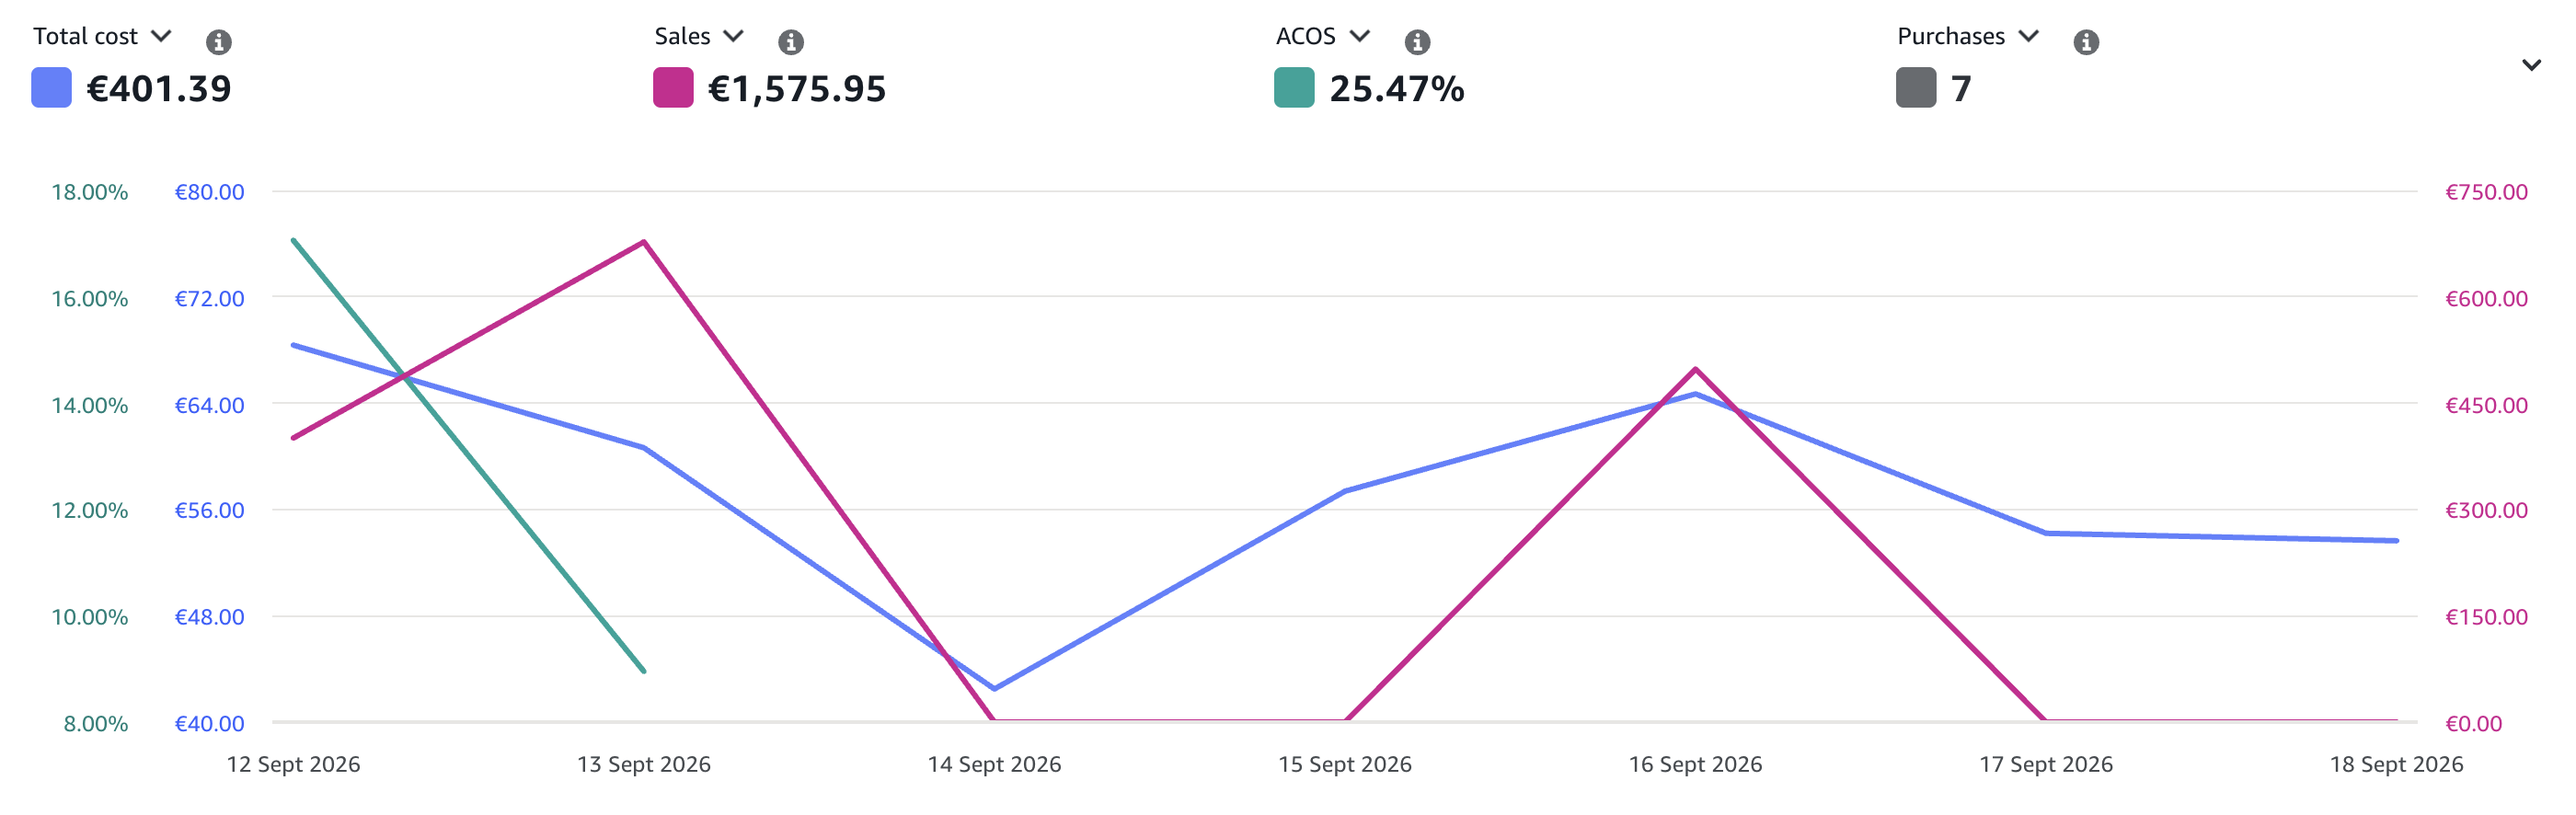
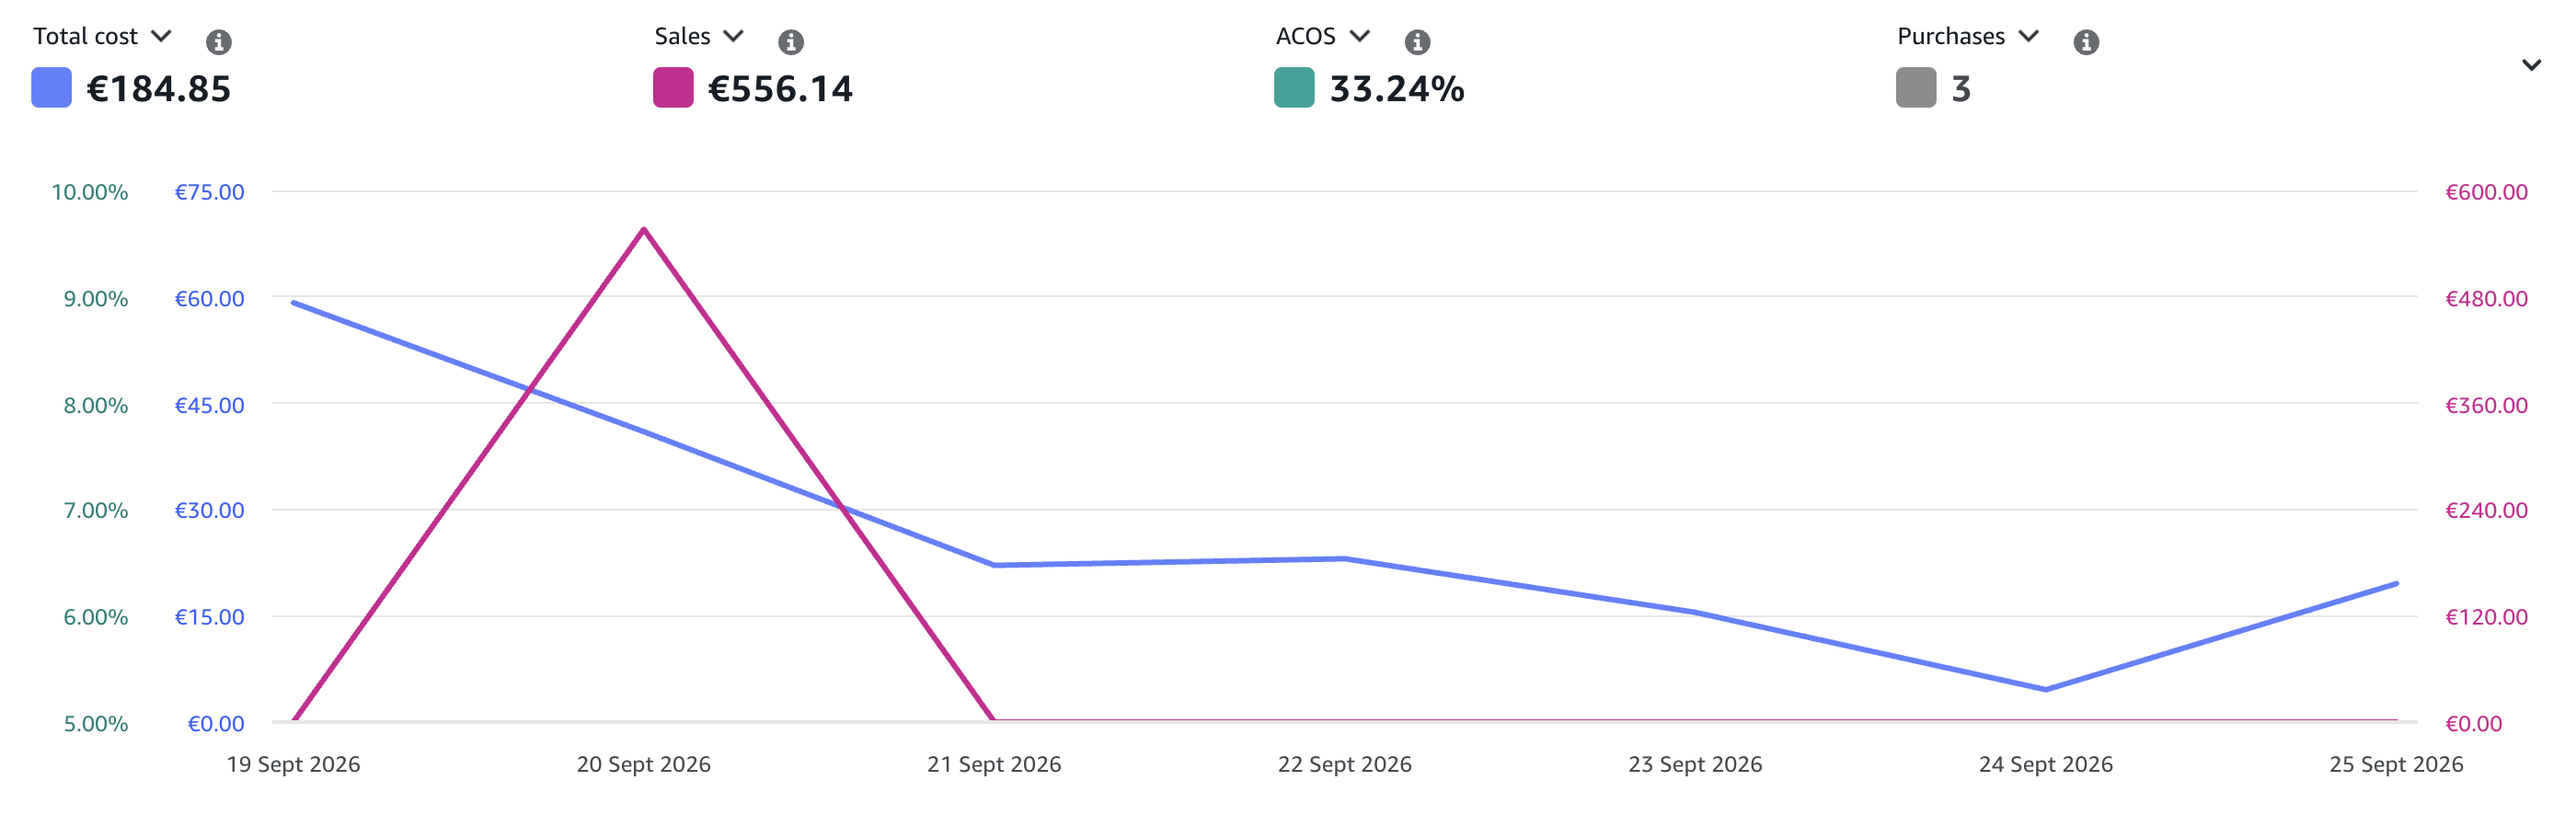
Chart scales can differ; compare the numbers, not the height of the lines.
Our proposed action plan
Locate the largest reported declines
Reconcile campaign totals, then compare both search-term and targeting reports with matching attribution settings. List text queries and product targets separately. Prioritize the largest observed purchase or sales differences where both windows are reported. Keep gaps visible instead of completing the list with assumed zeroes.
Choose the diagnostic branch
For each shortlisted segment, add available impressions, clicks, costs and purchases. A visibility change prompts a delivery check; similar traffic with fewer purchases prompts an offer check. Deliver a three-item review list showing the observed change, missing evidence and next report, without declaring either explanation proven.
Set the product allowance
Use the advertised-product report and a verified product relationship to add price, fees, costs and stock. Calculate the margin available before advertising under the agreed cost model. Produce an allowance for the shortlisted product, leaving unknown costs open rather than substituting the campaign average.
Prepare the appropriate targeting proposal
A supported text query may justify an Exact test after existing coverage is checked; a product context needs a product-target review. Name one setting, starting value, cost boundary and review date. If report coverage or economics is missing, request that input and keep the proposal unapproved.
The starting point
For September 12–18, the campaign reports €401.39 in spend, €1,575.95 in attributed sales and seven purchases. September 19–25 reports €184.85, €556.14 and three purchases. The captures concern the same campaign in Germany, with seven days and the same weekdays in each window.
ACoS uses the period totals: advertising cost divided by attributed sales. The later 33.24% means €33.24 in ads for every €100 of attributed sales, compared with €25.47 earlier. Lower absolute spend and a worse ratio can therefore both be accurate. Without product costs, these numbers establish neither a precise loss nor the profit remaining after advertising.
The strategic question
Automatic targeting combines text queries and product contexts. A decline concentrated in one reported product target calls for a different review from a decline spread across search queries. Build those branches separately. A product identifier is not a text keyword and should not be copied into an Exact-keyword campaign.
Next ask whether the segment received fewer impressions or clicks, or whether reported purchases changed at comparable traffic. The captures lack those traffic measures, so click price and conversion rate remain unknown. Product economics form a separate check: a segment can have attributable purchases yet exceed the advertising allowance of its product.
How we would judge the test
If a proposal is approved, review its specific query or product target across every affected campaign. A new manual destination must not hide continuing costs in the automatic source. Retain separate report scopes unless a relationship has been verified.
Use complete, equal-length windows and record price, stock and listing changes. Compare the segment with its product allowance and stopping boundary. Three reported purchases warrant a cautious review, not a stable forecast; extend observation rather than relaxing the boundary to obtain a more attractive result.
What this weekly comparison establishes
Keep the original periods and the evidence needed for a follow-up test documented separately.
- 01 · Preserve the baseline
- The earlier original capture contains €401.39 in spend, €1,575.95 in attributed sales and 25.47% ACoS.
- 02 · Document one change
- No Uptova change or other specific intervention is established for the time between these captures.
- 03 · Measure on equal terms
- The later original capture contains €184.85 in spend, €556.14 in attributed sales and 33.24% ACoS.
When to act — and when to wait
For now, hold campaign-wide changes and complete the three-item diagnostic list. Revisit one targeting proposal when its reported segment, verified product relationship and margin are known. Approve only a bounded setting change; stop or reassess when its agreed cost limit or offer condition is breached.
Before approving a change
- Largest reported declines located
- Traffic and offer branches distinguished
- Product-level allowance documented
- Source and proposed destination reviewed together
The central lesson
A useful automatic-targeting review explains which demand deserves which next decision.
Evidence, methodology and further reading
Cost per click, click-through rate, conversion rate and the causes of changing demand are not established by the captures.
How to read these case studies
- The high-resolution originals were captured directly in an authenticated Amazon Ads session on October 21, 2026. Every capture shows exactly one campaign in Germany. The first ten analyses cover September 19–25; five additional cases also compare September 12–18, 2026. Both weeks contain the same weekdays.
- These campaigns are a deliberately selected sample from one advertising account, not a representative average. Data is not combined across sellers. Account names, campaign names and IDs have been removed by cropping; numbers, chart lines, scales and dates are unchanged.
- ACoS = ad spend ÷ attributed ad sales. The period ratio uses period totals, not the average of daily percentages. Attributed ad sales are neither total revenue nor profit; margins, returns, taxes and organic revenue are absent from these captures.
- The five before-and-after comparisons show observed time windows, not a controlled experiment or a documented Uptova intervention. Review ideas are recommendations, not documented interventions. Lower ACoS can accompany fewer purchases; a week establishes neither durable profitability nor incremental sales.
- The captures were retaken without the pointer after the chart animation finished, then cropped only. No chart was generatively retouched. Cost, sales and ACoS use separate scales, not a shared value scale; gaps in the ACoS line can represent days without a defined daily ratio.
- Reports can use different levels of detail and attribution windows. Queries, products and placements remain separate views unless their relationship is verified. The purchased-product report discussed in these review plans shows purchases of other products but no ad cost; it cannot supply ACoS per purchased product.